|
Background The way an engine management system monitors its Air / Fuel ratio is through the Oxygen Sensor (O2) stuck in the hot exhaust flow, usually before the catalytic converter. All O2 sensors are basically the same, with some being heated or others providing multiple signal lines. An O2 sensor generates a voltage from 0-1Volt. A reading of 0 volts describes a LEAN condition, while a reading of 1 volt descrigbes a RICH condition. Autometer, Cyberdyne, Intellitronix, and many others manufacter A/F Gauges costing at least $30 or more . It is almost a certainty that all of those gauges uses the exact same driver chip to light up their display. The only difference between the gauges will probably be the resolution of the display, which should be adjustable. Is this for you? This is for people who would like to create an inexpensive Air / Fuel meter. PLEASE read this entire procedure before taking this project on. No one but you is responsible if you burn yourself or screw up your car in anyway. Basic soldering skills are a necessity. If you decide to solder the driver chip directly, DO NOT leave the soldering iron on the chip to long as the heat will destroy the chip fairly quickly. This DIY gauge can look pretty nice as you can carve out a little section in your cluster or dash and put the bargraph in there. but if you leave it dangling out, it doesn't look pretty. Total cost: for this project is ~$10 bucks. ~$4 bucks if you manage to obtain some parts for free. No responsibility is taken if you break something while trying to execute this procedure. You should be familiar with engine tuning, engine management wiring, and electricity in general. A Bentley manual will also come in very handy. |
|
|
|
|
The Diagram
|
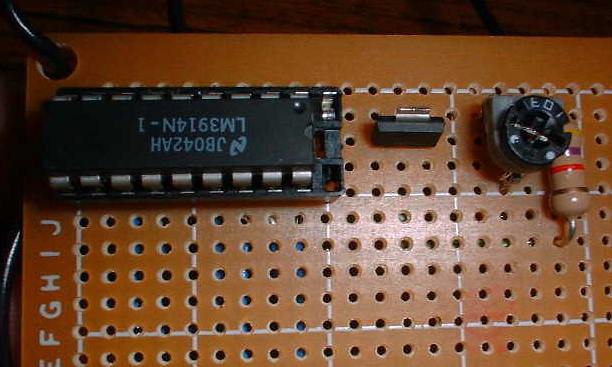
Bread Board Experimenting 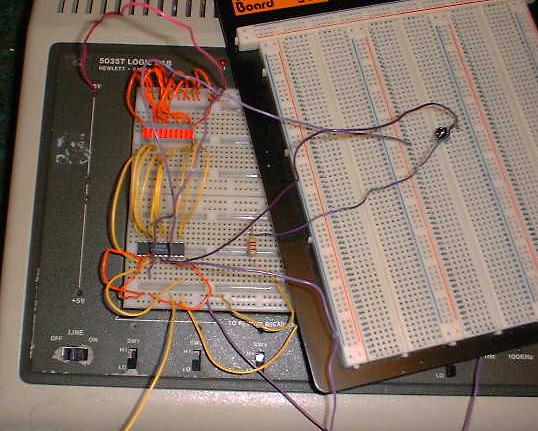 |
|
Socket Close Up 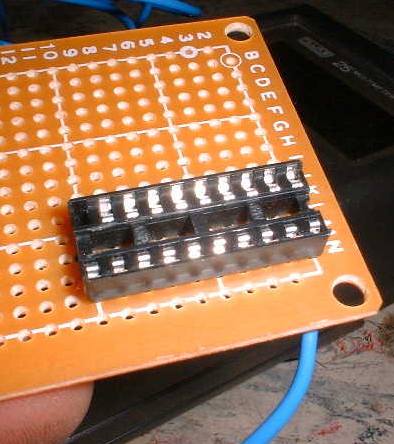 |
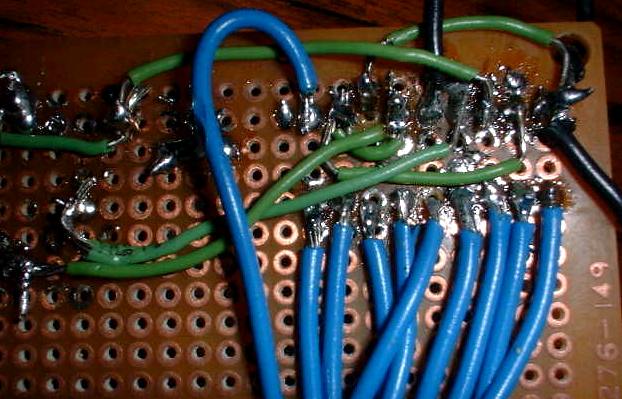
Wiring the LED Socket 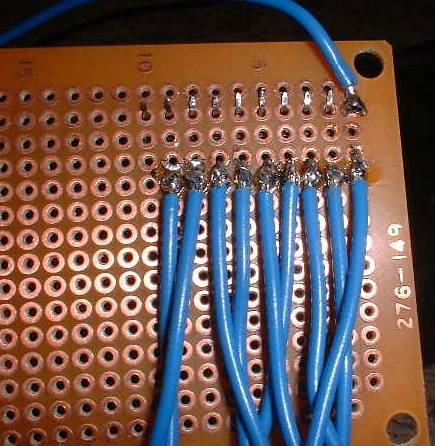 |
|
Topside, finished circuit
|
Extra Long Leads for the LED Display 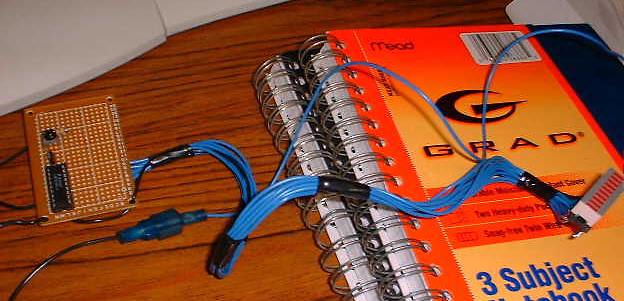 |
|
Bottomside, finished circuit
|
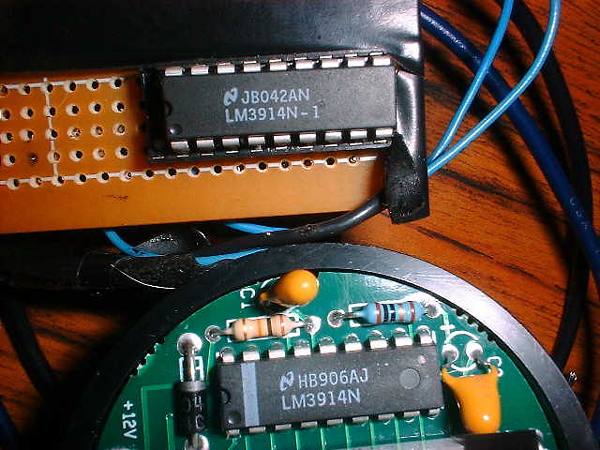
Chip Comparison
|
|
LED Comparison
|
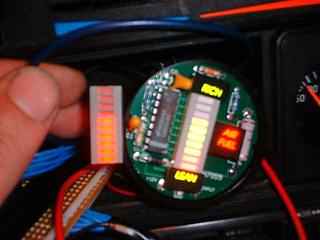
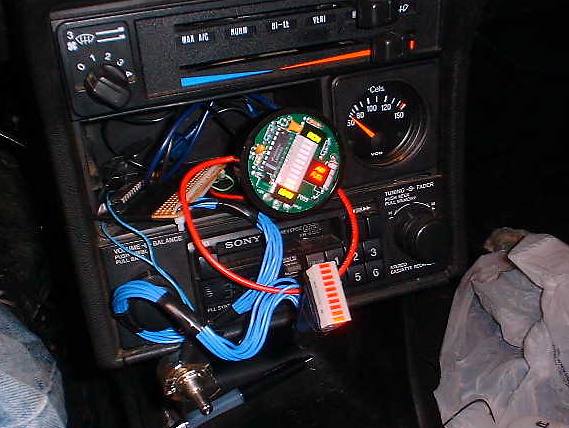
Test installation
|
|
The Run Down Chip sockets should probably be used as it is easier and there are fewer things that could go wrong. You don't have to though. but make sure when you use the sockets that you don't get the pins reversed when soldering. You can also un-solder the sockets out of old electronics or mother boards if you need some quickly. If you solder a bunch of wires from the chip to the LED socket you can have some placement flexibility for the LED display. Be aware that LED's only work one way. they have a Positive side and Negative side. There's a flat spot in the corner of the bargraph 'chip' to indicate Pin 1. There are many differant ways to make this a clean well executed project, but as always, the end result if from your own efforts. Such niceities as terminating the wires with connectors and what not. you can also use floppy drive ribbon cables to connect all the circuits together, which will make it easy and neat to mount the LED graph separately. Most people want the wide band of the O2 measuring from 0-1v. But some might want a Finer Resolution. Where it'll measure from 0.4-1v. This would mean that the 1st LED will be ~0.4v and the 10th LED will be 1v. Engines equipped with a turbo, blowers, or Nitrous, might want a finer resolution as the Air / Fuel ratio is especially critical for those motors. In a Naturally Asperated engine, the finer resolution might not be necessary as the proper mixture (14.7:1) is at about 0.5v from the O2 sensor. Resistor R1 is what determines the resolution for the LED display. Resistor R2 is what determines the relative brightness of the LED. You can stick potentiometers in place of these resistors in order to fine tune the bar graph resolution and display brightness. If you decide to use the Potentiometer (POT) you need to get a Ohm meter and measure the range at which resistance ranges from 2.3k to 3.3k . As it is adjustable, you can change it later. In order to run the display at the finest resolution possible, take out R1 and run it straight with no resistor in there. It should be that simple. During experimentation I had the resolution up to 0.7v as the 1st led, but i can't figure what i did to get that. I know it has something to do with the resistor as there are people out there that sell modified gauges that does this.. I will eventually figure it out. e-mail me about it if you'd like to discuss it further. Feel free to play around with it. Currently it is setup as BAR mode. If you prefer DOT mode, disconnect pins 3 and 9. DOT mode is when one LED will light up at a time, while BAR mode all lights will light up, building to the final value. Installation is as straight forward as you want it to be. Hook up the power to an accessory line, and connect up the ground to any clean metal. Connect up the Signal Wire to your O2 sensor. For testing purposes, I ran a wire out into my hood and just pushed it in the O2 sensor plug for now. Check your Bentley wiring diagrams to find the best place to connect to the O2 wiring harness. Note that the voltages from the O2 sensor are very low, so take extra care in taping the signal wire and make a high quality connection. This is whatI gathered for my Intellitronix gauge. The table represent what the lights signify. Please keep in mind that this is for the non modifed gauges and in the the measurements are in the wider resolution mode. This should be pretty close, but don't hold me to these values. LED 10 - 0.97V - 12.1:1 - Very Rich - Forced induction and nitrous. you might
want to be around here. (All LEDs on) |
|